Understanding and Implementing Causal Profiling with Coz and Cozgo
cozgo, a Go wrapper for the Coz library for causal profiling in Go projects.
I recently came across an intriguing paper titled “Coz: Finding Code that Counts with Causal Profiling” by Emery D. Berger, Ting Yang, and Andrew McGregor. This paper introduces a novel profiling technique known as causal profiling, which aims to identify and optimize the most critical parts of a codebase that directly impact performance.
Intrigued by the potential of causal profiling, I decided to dive deeper and implement a wrapper in Go for the coz library, which is the practical implementation of the concepts discussed in the paper. This post details my journey through understanding causal profiling and creating the Go wrapper, cozgo.
What is Causal Profiling?
Causal profiling is a method that helps developers understand the performance impact of different parts of their code. Traditional profilers provide a detailed breakdown of where time is being spent in a program, but they often fall short in guiding developers on which changes will yield the most significant performance improvements.
Coz, the tool introduced in the paper, takes a different approach. It allows developers to perform “virtual speedups” on specific parts of their code and measure the effect on overall performance. By simulating the impact of speeding up certain code sections, Coz identifies the true bottlenecks that, when optimized, will result in the most substantial performance gains.
From the authors 1:
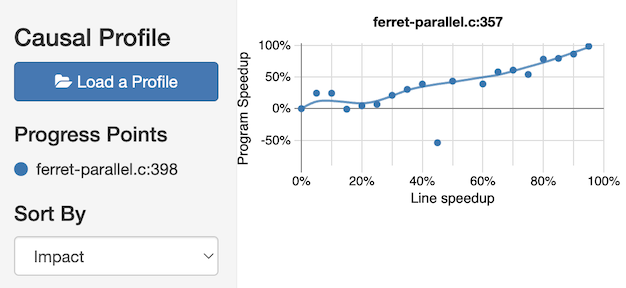
Profiles generated by Coz show the "bang for buck" of optimizing a line of code in an application. In the below profile, almost every effort to optimize the performance of this line of code directly leads to an increase in overall performance, making it an excellent candidate for optimization efforts.
The have a handy example explaining what potential speedups could look like:
Implementing the Go Wrapper: cozgo
To make Coz accessible to Go developers, I created a wrapper called Cozgo. This wrapper allows Go programs to utilize the powerful capabilities of Coz without leaving the Go ecosystem.
Getting Started with cozgo
To get started with cozgo, you’ll need to have the Coz library installed. You can find the installation instructions on the Umass Coz Github Repo
Once Coz is installed, you can integrate cozgo into your Go projects. Here’s a step-by-step guide:
1. Install cozgo
First, add cozgo to your Go project by running:
go get github.com/urjitbhatia/cozgo2. Instrument Your Code
Next, you’ll need to instrument your Go code to use cozgo. This involves marking the sections of your code that you want to profile. Here’s an example:
package main

import (
    "fmt"
    "time"

    "github.com/urjitbhatia/cozgo"
)

func main() {
    cozgo.Begin("main")

    fmt.Println("Starting the program...")
    time.Sleep(2 * time.Second) // Simulating some work

    cozgo.End("main")
}
In this example, we use cozgo.Begin("main") and cozgo.End("main") to mark the beginning and end of the section we want to profile. Coz will measure the performance impact of this section.
3. Run Your Program with Coz
To profile your program with Coz, run it using the coz command:
coz run -- go run main.goCoz will execute your program, apply virtual speedups, and provide a detailed report on the performance impact of the marked sections.
Understanding the Results
After running your program with Coz, you’ll receive a report indicating which parts of your code, if optimized, would yield the most significant performance improvements. This insight allows you to focus your optimization efforts where they will have the greatest impact, leading to more efficient and performant code.
Conclusion
Causal profiling with Coz offers a powerful way to identify and optimize the critical parts of your codebase that directly impact performance. By creating cozgo, I aimed to bring the benefits of causal profiling to the Go community, making it easier for Go developers to leverage this innovative technique.
I encourage you to explore the cozgo repository on GitHub and try it out in your projects. By focusing your optimization efforts where they matter most, you can achieve significant performance gains and build more efficient applications.
Happy profiling!
Footnotes
-
source: Coz GitHub repository ↩